AUD/USD Climbs on Jobs Report as Wedge Pattern Eyes Breakout
AUD/USD posts positive week after employment report reduces rate cut bets


- AUD/USD remains within its October range as the currency eyes a positive week of trading.
- Australia’s employment report surprised to the upside, reducing rate cut bets for the Reserve Bank of Australia (RBA).
- A bullish wedge pattern provides encouragement for a breakout in the coming weeks.
Despite a slightly stronger dollar, via the DXY index, AUD/USD managed to tick slightly higher on Friday, rising by about 0.15% in afternoon U.S. trading. The Australian employment report surprised to the upside this week, with the country’s unemployment rate dropping to 4.3%. That reduced rate cut odds, likely explaining some of the strength this week.
Friday’s move helped the currency rise about 0.73% for the week, although prices remain inside of last week’s open/closing range. Zooming out a bit, this month’s price action puts the currency at about a 0.08% loss, with prices remaining contained within the October swing high/low levels. In fact, prices have retracted to the pseudo 50% Fibonacci retracement level from that range. Indecision within the range shows that AUD/USD traders haven’t come to a consensus on the direction for the currency’s path yet.
Bullish wedge pattern on the weekly chart gives hope of a possible breakout
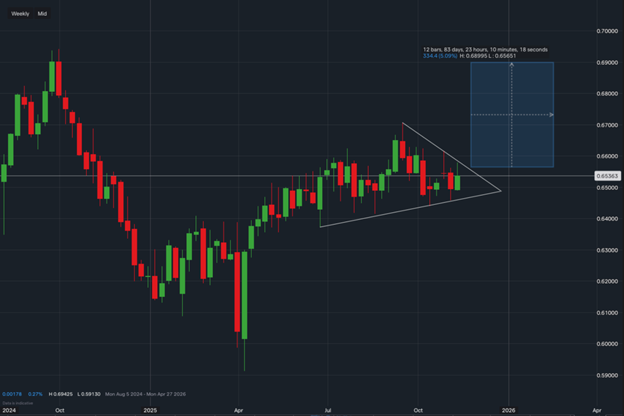
Zooming out to the weekly chart, we see that a symmetrical wedge pattern has formed, with the bottom of the wedge starting in late June and the top of the wedge defined by the September highs. Prices rallied into the wedge formation, suggesting that this could be a bullish wedge that could see an upside breakout if prices manage to pierce above the pattern. If we assume an upside breakout is to occur, we can take the measured move to gauge the upside target once resistance breaks. The measured move is defined by the widest part of the pattern, which measures 0.03344. That could put prices within touching distance of the 0.69000 level, which is where 2024 trading saw resistance. Alternatively, a clean break below the pattern’s support would invalidate the pattern and dash hopes of a breakout.
Trading forex requires an account with a forex provider like tastyfx. It’s important to manage your risks carefully as losses can exceed your deposit. Ensure you understand the risks and benefits associated with trading leveraged products before you start trading with them.